Logs & Monitoring
Reading build logs, diagnosing runtime errors, understanding analytics and Speed Insights, and knowing when Vercel itself is the problem.
Something broke. Or maybe nothing broke, but you want to understand what your site is actually doing in production. This page covers how to find answers using Vercel's built-in tools.
Most errors on a deployed site fall into one of two categories: build-time errors (the site failed to deploy) and runtime errors (the site deployed but something doesn't work). Each has a different place to look.
The Excel Analogy
Vercel's logs are like Excel's formula audit trail. When a formula returns #REF!, you click "Trace Error" to find which cell is causing the problem. Build logs are your trace — they show you exactly which step failed and why.
Runtime logs are like Excel's Evaluate Formula feature — you can step through what's happening as the formula runs, see intermediate values, and spot where things went wrong.
Build Logs — When a Deploy Fails
A failed deployment means the build process encountered an error. The live site was not updated — it continues serving the last successful deployment. Your job is to find the error, fix it, and push again.
How to access build logs
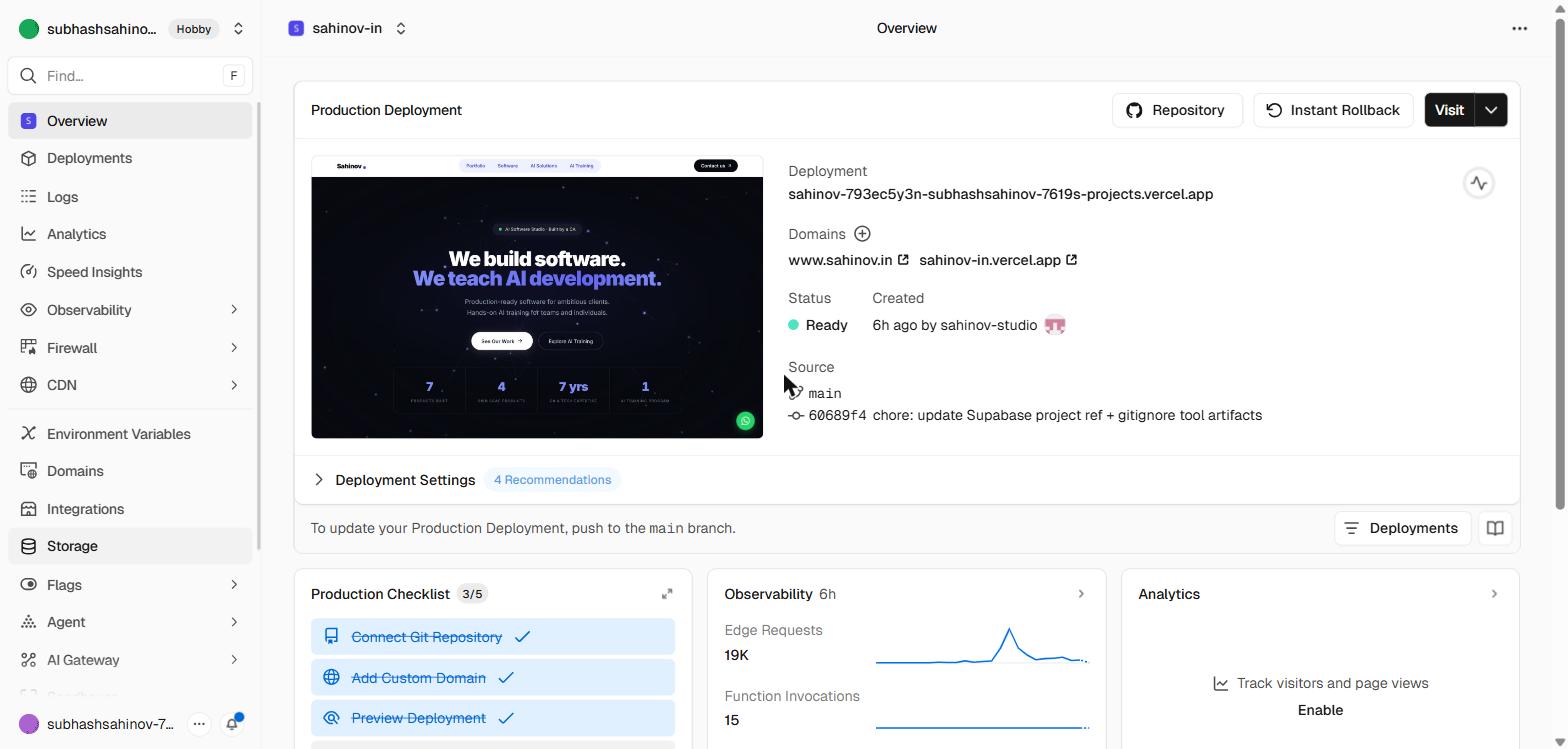
Open your project in the Vercel dashboard
Click your project name to open the project overview.
Go to the Deployments tab
You'll see a list of all deployments. Failed ones show a red "Error" badge. The most recent one is at the top.
Click the failed deployment
This opens the deployment detail page.
Click "Building" or the build log area
The full build log appears. Lines are ordered chronologically — the last few lines before the error are what you need.
Reading a build log
Build logs are long but follow a predictable pattern. The important lines are near the bottom — after "Failed to compile" or "Error". Scroll to the end of the log and read the last 5–10 lines. The error message will name the file and the line number where the problem is.
Fix that error in VS Code, push the fix to GitHub, and the next deployment will succeed.
Common build errors and their causes
| Error message | Likely cause | Fix |
|---|---|---|
Module not found: Can't resolve './SomeFile' | A file was renamed or deleted but an import still references the old name | Update the import path |
Type error: X is not assignable to type Y | TypeScript found a type mismatch — something that works on localhost but fails in strict production build | Fix the TypeScript error locally first |
Error: NEXT_PUBLIC_SUPABASE_URL is not defined | Environment variable missing in Vercel settings | Add the variable in Settings → Environment Variables, then redeploy |
Cannot find module 'some-package' | A package is in your code but not in package.json | Run npm install some-package locally, commit the updated package.json |
npm ERR! code ENOENT with wrong directory | Root Directory is misconfigured | Check Settings → General → Root Directory |
Build errors on Vercel that don't appear on localhost usually have one of two causes: a TypeScript error that your local config ignores but Vercel's strict build catches, or a missing environment variable. Both are fixable within minutes once you read the log carefully.
Runtime Logs — When the Site Loads But Something Doesn't Work
Runtime logs capture what happens after the site loads — specifically, what happens in server-side code (Next.js API routes, Server Components, Edge Functions). If you're building a pure frontend Vite app, most of your runtime debugging will happen in the browser console rather than Vercel's runtime logs.
How to access runtime logs
Open your project and go to the Deployments tab
Click the most recent successful deployment
Click "Runtime Logs" in the deployment detail page
You'll see a live log stream (or historical logs if you're not in real time). Each line represents something that happened on the server side.
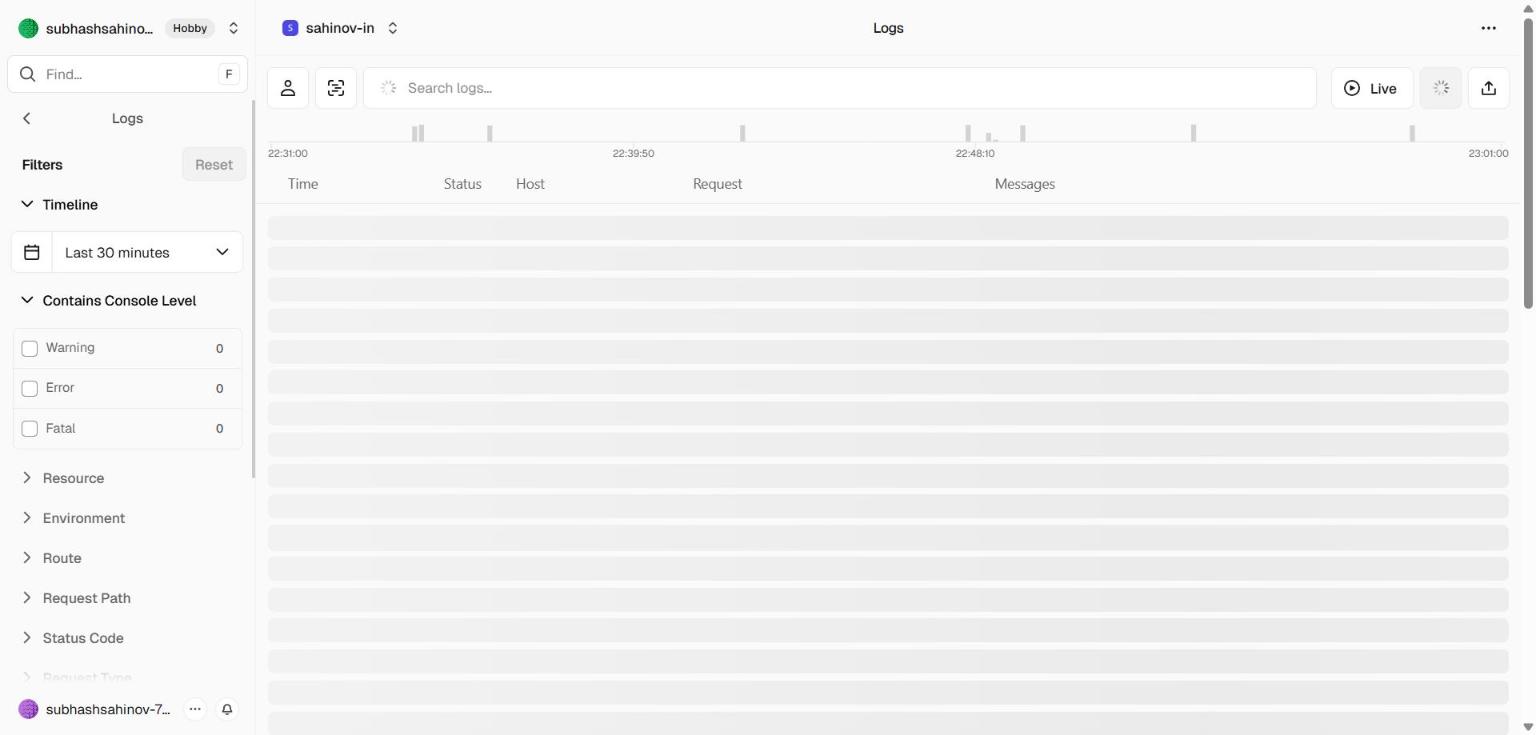 The runtime logs panel. Each row is one server-side event — an API route call, a Server Component render, an edge function invocation. Filter by status code, function path, or time range.
What runtime logs show
For Next.js projects with server-side code:
console.log()statements in API routes and Server Components- Uncaught exceptions in server-side code
- Edge function invocations and their output
- Request/response details for API routes
For pure Vite frontend apps: runtime logs will be mostly empty. Your debugging happens in the browser's DevTools console, not Vercel.
The Browser Console — Your Most Useful Tool
For the kinds of projects you'll build in training, the browser's developer console is where most errors appear — not Vercel's logs. When something doesn't work on your deployed site:
Open your deployed site in the browser
Press F12 (Windows) or Cmd + Option + I (Mac)
The DevTools panel opens.
Click the Console tab
Any JavaScript errors, failed API calls, or console.log output appears here.
Look for red error lines
Red lines indicate errors. Click on a red line to expand it and see the full error message and stack trace.
F12, go to the Console tab. A healthy deployed site shows zero red lines. If you see red errors, the most useful ones to read are: the first red line (usually the root cause), and any lines mentioning undefined, a URL, or a failed network request.The most common console errors on a freshly deployed site:
| Console error | What it means |
|---|---|
supabaseUrl is required | VITE_SUPABASE_URL or NEXT_PUBLIC_SUPABASE_URL is missing from Vercel settings |
Failed to fetch (on a Supabase URL) | Supabase URL is wrong, or Supabase project is paused |
401 Unauthorized on Supabase | Anon key is wrong or missing |
TypeError: Cannot read properties of undefined | Data is undefined where the code expected an object — usually a missing env var causing a failed API call |
Analytics
Vercel Analytics shows traffic data for your site — how many visitors, which pages they visit, which countries they're from.
To enable: open your project → Analytics tab → click Enable. For the Hobby plan, basic analytics are included free.
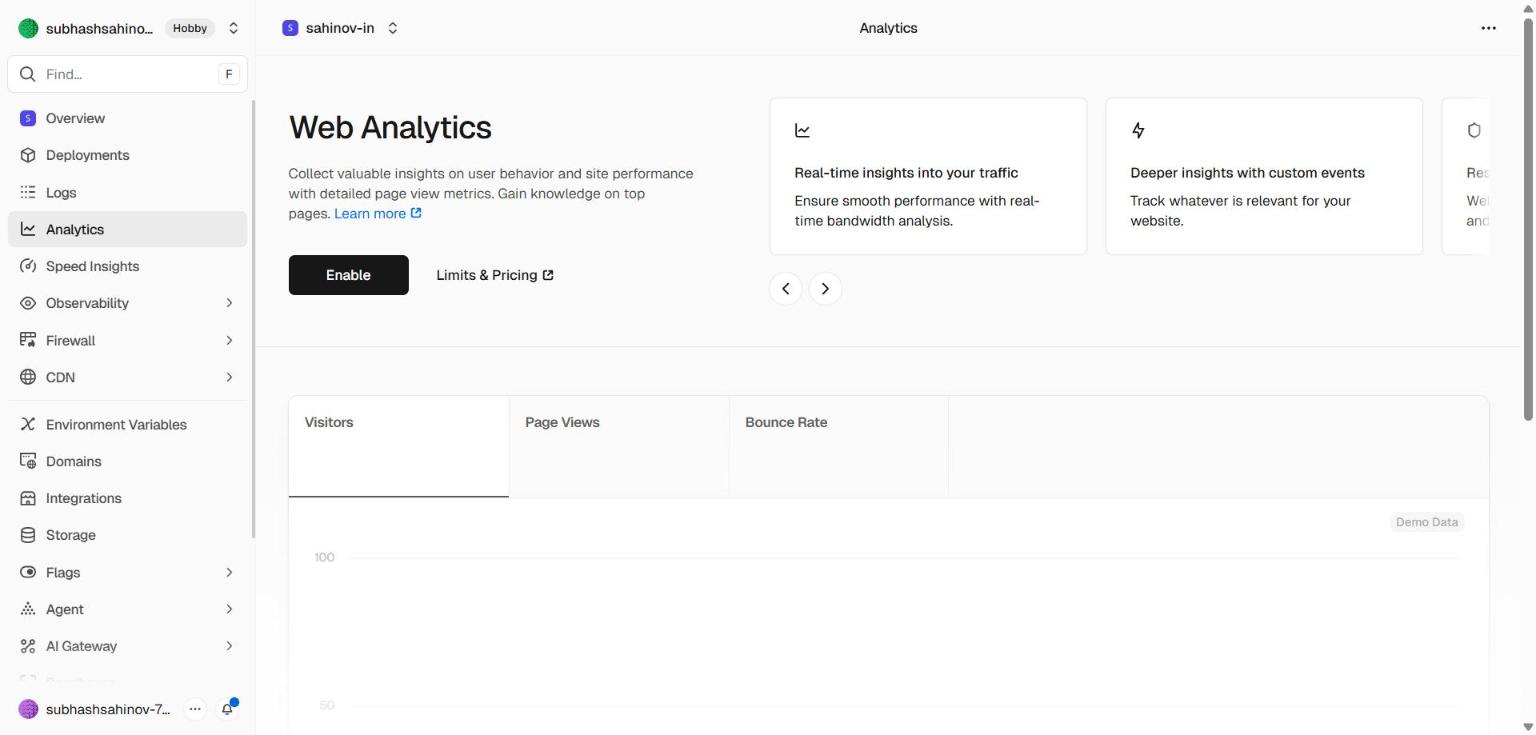 Vercel Analytics — visitor counts, top pages, referrers and country breakdown, all collected automatically once you click Enable.
What you'll see:
- Visitors — unique visitors per day/week/month
- Page views — which routes get the most traffic
- Top pages — your most visited pages
- Referrers — where traffic is coming from (Google, direct, etc.)
Analytics is a passive tool — it collects data automatically once enabled. You don't need to add any code to your project for basic page view tracking.
Speed Insights — Core Web Vitals
Speed Insights tracks how fast your pages actually load for real users — not simulated tests, but measurements from real browser visits.
To enable: open your project → Speed Insights tab → click Enable. You'll also need to add the @vercel/speed-insights package to your project:
Then add it to your app's root component (one line of code — the Speed Insights tab in the Vercel dashboard shows the exact setup for your framework).
What gets measured:
| Metric | What it means | Good value |
|---|---|---|
| LCP (Largest Contentful Paint) | How long until the main content loads | Under 2.5 seconds |
| CLS (Cumulative Layout Shift) | How much the page "jumps" as it loads | Under 0.1 |
| INP (Interaction to Next Paint) | How quickly the page responds to clicks | Under 200ms |
| FCP (First Contentful Paint) | When the first content appears | Under 1.8 seconds |
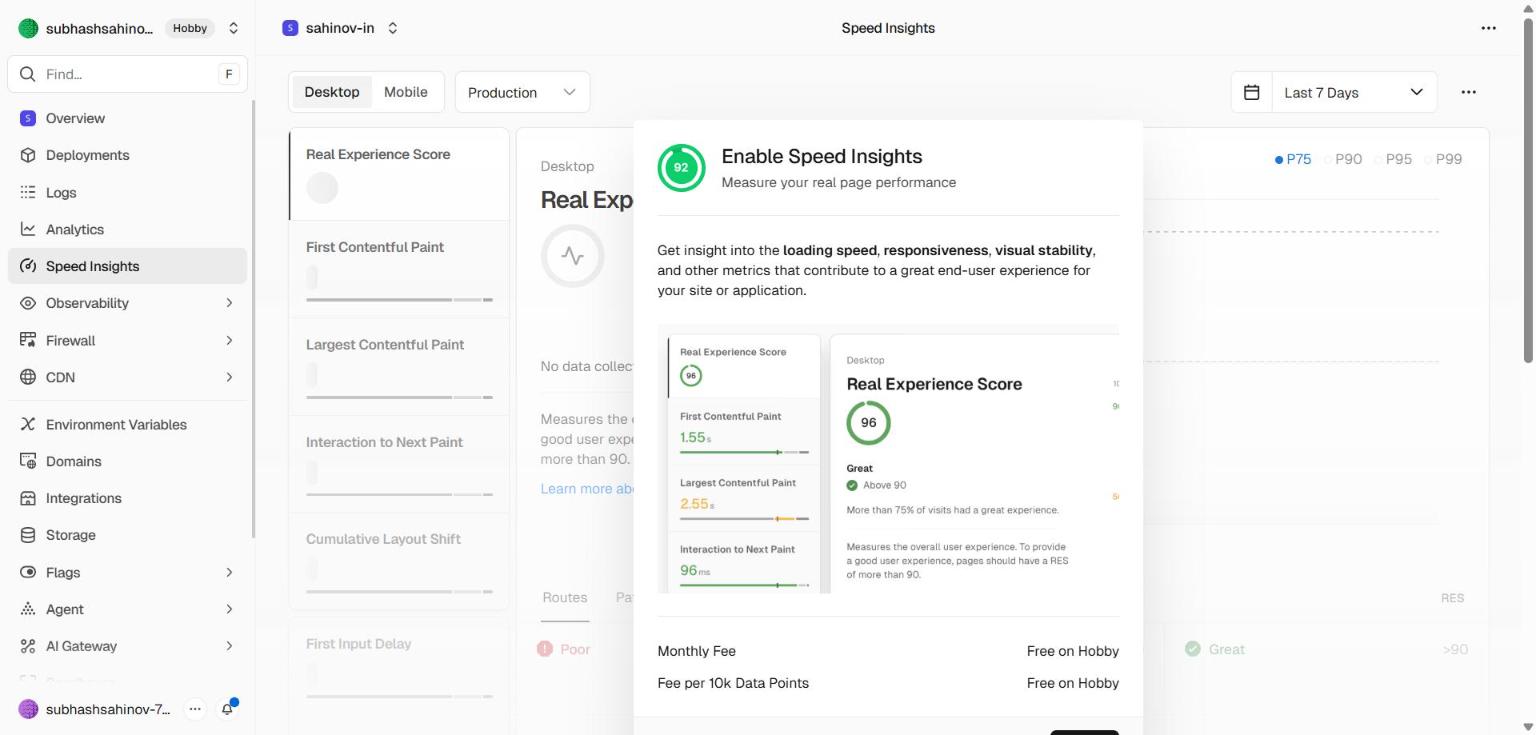 Speed Insights shows real-user Core Web Vitals — measured in actual browsers, not synthetic tests. Each metric is graded Good / Needs Improvement / Poor at the 75th percentile.
You'll revisit these metrics properly in the Admin Analytics module. For now, knowing they exist and how to find them is enough.
Observability
The Observability tab is Vercel's unified view across logs, traces, and errors. Where Runtime Logs show one event per row and Analytics shows aggregate traffic, Observability connects the dots — it links a slow request to its build, its function invocation, and the user-facing route.
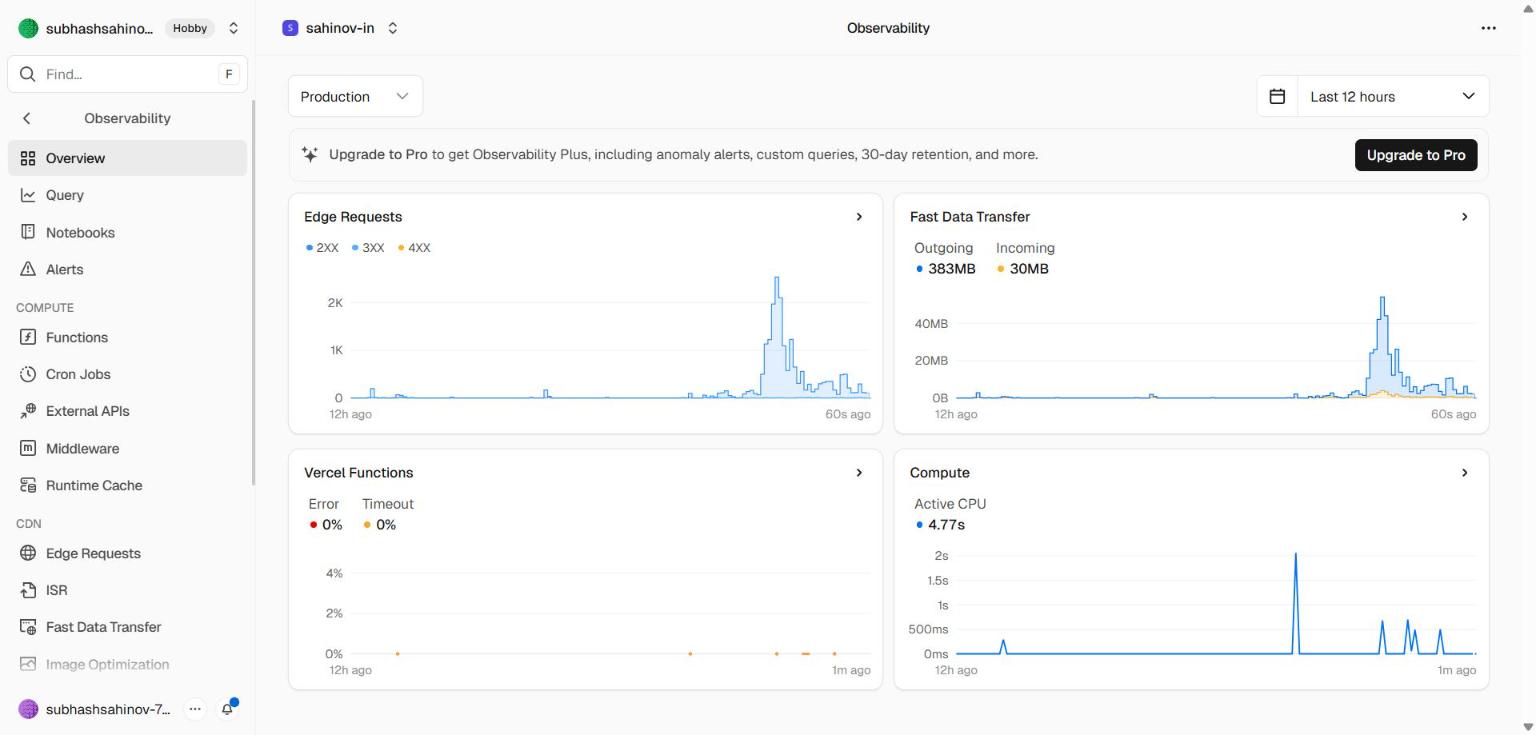 Observability surfaces requests-per-second, error rates, slowest routes, and function-level performance in a single view. Useful when something feels slow but you can't tell which page or function is responsible.
What you can do here:
- Spot anomalies — a sudden spike in 500 errors, a route that just got 10x slower
- Drill from a metric directly into the runtime logs for the time window where it spiked
- See cost-relevant signals (function invocations, bandwidth, compute time)
For training projects, Observability is informational. On Aurora Public School and other client projects, this is where you'll go first when a user reports "the site felt slow yesterday" — the timestamp narrows your search instantly.
Firewall
The Firewall tab is Vercel's built-in Web Application Firewall (WAF). It sits in front of your deployment and decides whether each incoming request reaches your app at all.
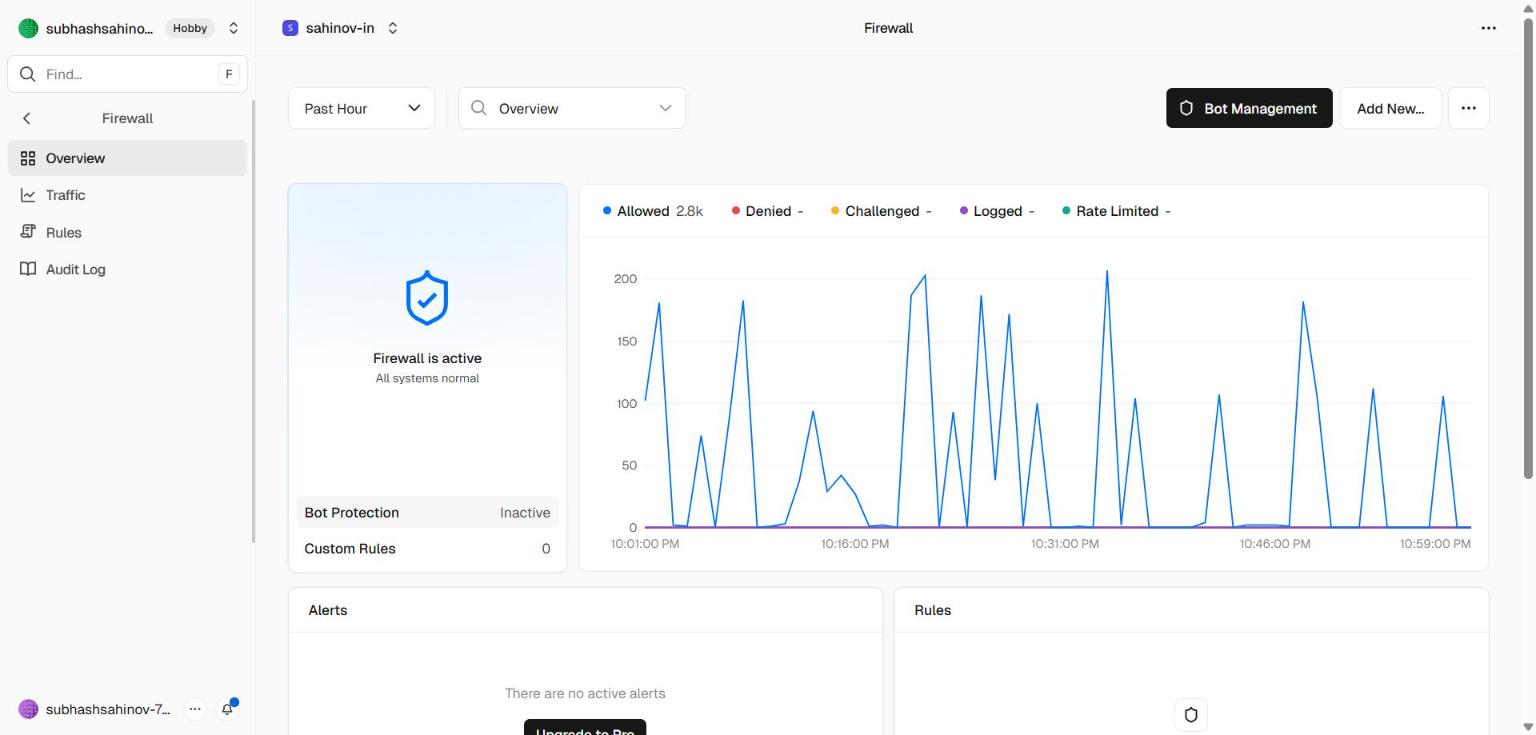 The Firewall panel — managed rules (DDoS protection, bot mitigation) on by default, plus custom rules you can add for IP blocks, country restrictions, or rate limits.
What's free on the Hobby plan:
- DDoS mitigation — Vercel automatically absorbs traffic floods at its edge before they reach your code
- Basic bot detection — known bad actors are blocked
- Attack log — visibility into requests that were challenged or blocked
What's available on Pro/Enterprise:
- Custom firewall rules (block by IP, country, header, path, rate limit)
- Bot management with CAPTCHA challenges
- Detailed attack analytics
For training, you don't need to configure anything here — defaults are sensible. But it's worth knowing this exists so that when a client asks "is our site protected against attacks?" you can answer specifically.
Storage
The Storage tab lists data services Vercel offers — Postgres, KV (Redis), Blob storage, Edge Config. We use Supabase for all data needs, so this tab is informational only.
 Vercel Storage. Mentioned for completeness — we use Supabase for database, auth, and file storage instead.
You will not enable any of these for projects in this workshop. Supabase is the single backend for everything we build.
Vercel Status Page
Before you spend an hour debugging your code, check whether Vercel itself is having issues. It happens rarely, but when Vercel has an incident, your deployments may fail or your site may load slowly for reasons entirely outside your control.
Visit vercel.com/status.
The page shows the current status of all Vercel systems:
- Build system
- Deployment pipeline
- Edge network
- Dashboard
If you see yellow (degraded) or red (outage) on the build system and your deployments are failing — wait. Vercel's team is already working on it. Check back in 30–60 minutes.
If everything on the status page is green and your deployments are still failing — the problem is in your code. Read the build log.
Deployment History as a Debugging Tool
The Deployments tab is more than a list of builds. It's a timeline of your project's history that you can use to pinpoint when a bug was introduced.
Scenario: Your site is working on Monday. On Wednesday a user reports something is broken. You've made three pushes since Monday.
What to do:
- Open the Deployments tab
- Find Monday's successful deployment
- Click "Visit" to open that old deployment — Vercel keeps every deployment live at its unique URL
- Confirm the bug doesn't exist in Monday's version
- Compare Monday's commit to your current code to find what changed
You can also use this to roll back. If the current deploy is broken and you need the site working immediately: find the last good deployment → click the three-dot menu → click "Promote to Production". The old deployment becomes the live site within seconds, giving you time to fix the code properly.