Uptime Monitoring — Overview
What uptime monitoring is, why it matters, and how to know your app is down before your clients do.
Your Vercel deployment is running. The build succeeded. You tested it before going to bed. Everything worked.
At 10pm, a parent opens the Aurora Public School app to pay their child's fees and gets an error — the screen just won't load. They close it, assume the app is broken, and move on. At 11am the next morning, the school admin calls to say the app was down all night. Real fee payments were missed. Real parents gave up.
You find out 13 hours later.
This is not a hypothetical. It happens on every production app eventually — a Vercel outage, a bad deploy, an expired Supabase free tier limit, or a misconfiguration that slipped through. The question is not whether your app will go down. It's whether you'll know about it within 5 minutes or 13 hours.
Uptime monitoring checks your app every few minutes and alerts you the moment it stops responding — before any user has to report it to you.
The "Why First" Scenario
Your CA firm client has been live for two weeks. Their staff are logging in daily. Everything seems fine.
On a Friday evening, a Supabase maintenance window causes a 3-hour outage on the free plan. The app returns errors for every user.
Nobody at your firm tells you — it's Friday evening. Your client's office manager emails on Monday morning: "The portal was broken all weekend. My staff couldn't file their timesheets."
You had no idea. There was nothing in your email. No alert. No warning. The app just quietly failed, and three days passed before you knew.
Uptime monitoring is the system that would have sent you an email at 6:04pm on Friday — 4 minutes after the outage started. You'd have known before your client did. You could have posted a message to them before anyone complained.
The difference between a professional operation and an amateur one is often not the quality of the code — it's the quality of the systems watching the code.
The Excel Analogy
Think of uptime monitoring like a checking account balance alert.
You set a rule: "If my account balance drops below ₹10,000, send me an SMS." The bank doesn't wait for you to log in and notice. It watches continuously and notifies you the moment the condition is met.
Uptime monitoring works identically:
- You set the rule: "If my app stops returning a successful response, alert me immediately"
- The monitoring service watches continuously — every 5 minutes, around the clock
- The moment the condition is met, it sends you an email
- When the app recovers, it sends you another email confirming recovery
You don't need to check anything manually. The system watches so you don't have to.
What "Uptime" Means
Uptime is the percentage of time your application is accessible and working correctly.
| Uptime % | Annual downtime | What this means |
|---|---|---|
| 99% | 87.6 hours / year | Acceptable only for internal tools |
| 99.9% | 8.7 hours / year | Standard for small commercial apps |
| 99.99% | 52 minutes / year | Enterprise grade — very hard to achieve |
| 99.999% | 5 minutes / year | What banks and payment systems target |
For context: Vercel's free (Hobby) plan does not include an uptime SLA. The Pro plan guarantees 99.99%. Supabase's free plan similarly has no uptime guarantee — they run maintenance windows and your app may be unavailable during those windows.
This is one reason larger projects move to paid plans — not just for more features, but for the reliability commitment.
What Causes Downtime
Understanding the causes helps you know what to monitor and what to do when an alert fires.
| Cause | What happens | How uptime monitoring catches it |
|---|---|---|
| Vercel outage | Your app URL returns an error or times out | Monitor hits the URL, gets no 200 response, alerts you |
| Supabase outage | App loads but all data queries fail | Monitor on the Supabase REST URL catches this |
| Bad deploy that crashes the app | App URL returns a 500 error | Monitor detects the 500, fires alert |
| Free tier limit exceeded | Supabase pauses the project, all queries fail | Monitor on Supabase URL detects the pause |
| Domain/DNS misconfiguration | URL doesn't resolve at all | Monitor fails DNS resolution, fires alert |
| Environment variable deleted | App loads but crashes on any action | Harder to catch — integration testing covers this |
The most common cause for trainees: exceeding the Supabase free tier row limits or monthly active user cap, which causes Supabase to pause the project silently. A dedicated Supabase monitor catches this within 5 minutes.
How Monitoring Works (Technically)
Every 5 minutes (on the free plan), the monitoring service sends an HTTP GET request to your URL — the same kind of request a browser makes when you type a URL and press Enter.
Your server responds with a status code:
| Status code | Meaning | Monitor treats it as |
|---|---|---|
| 200 | OK — everything worked | Up |
| 301 / 302 | Redirect — usually fine | Up (if it follows and reaches 200) |
| 404 | Page not found | Down |
| 500 | Server error | Down |
| No response | Timeout / server unreachable | Down |
The monitor logs each check result. If it gets a non-200 response (or no response) for 2 consecutive checks, it fires the downtime alert. This prevents false alarms from momentary network blips.
What You'll Have After This Section
| Page | What you'll be able to do |
|---|---|
| UptimeRobot Setup | Create an account and configure your first monitor |
| Alerts Configuration | Set up email alerts so you're notified within minutes of downtime |
| Status Page | Create a public status page your clients can bookmark |
| Verification | Confirm everything is working with a controlled test |
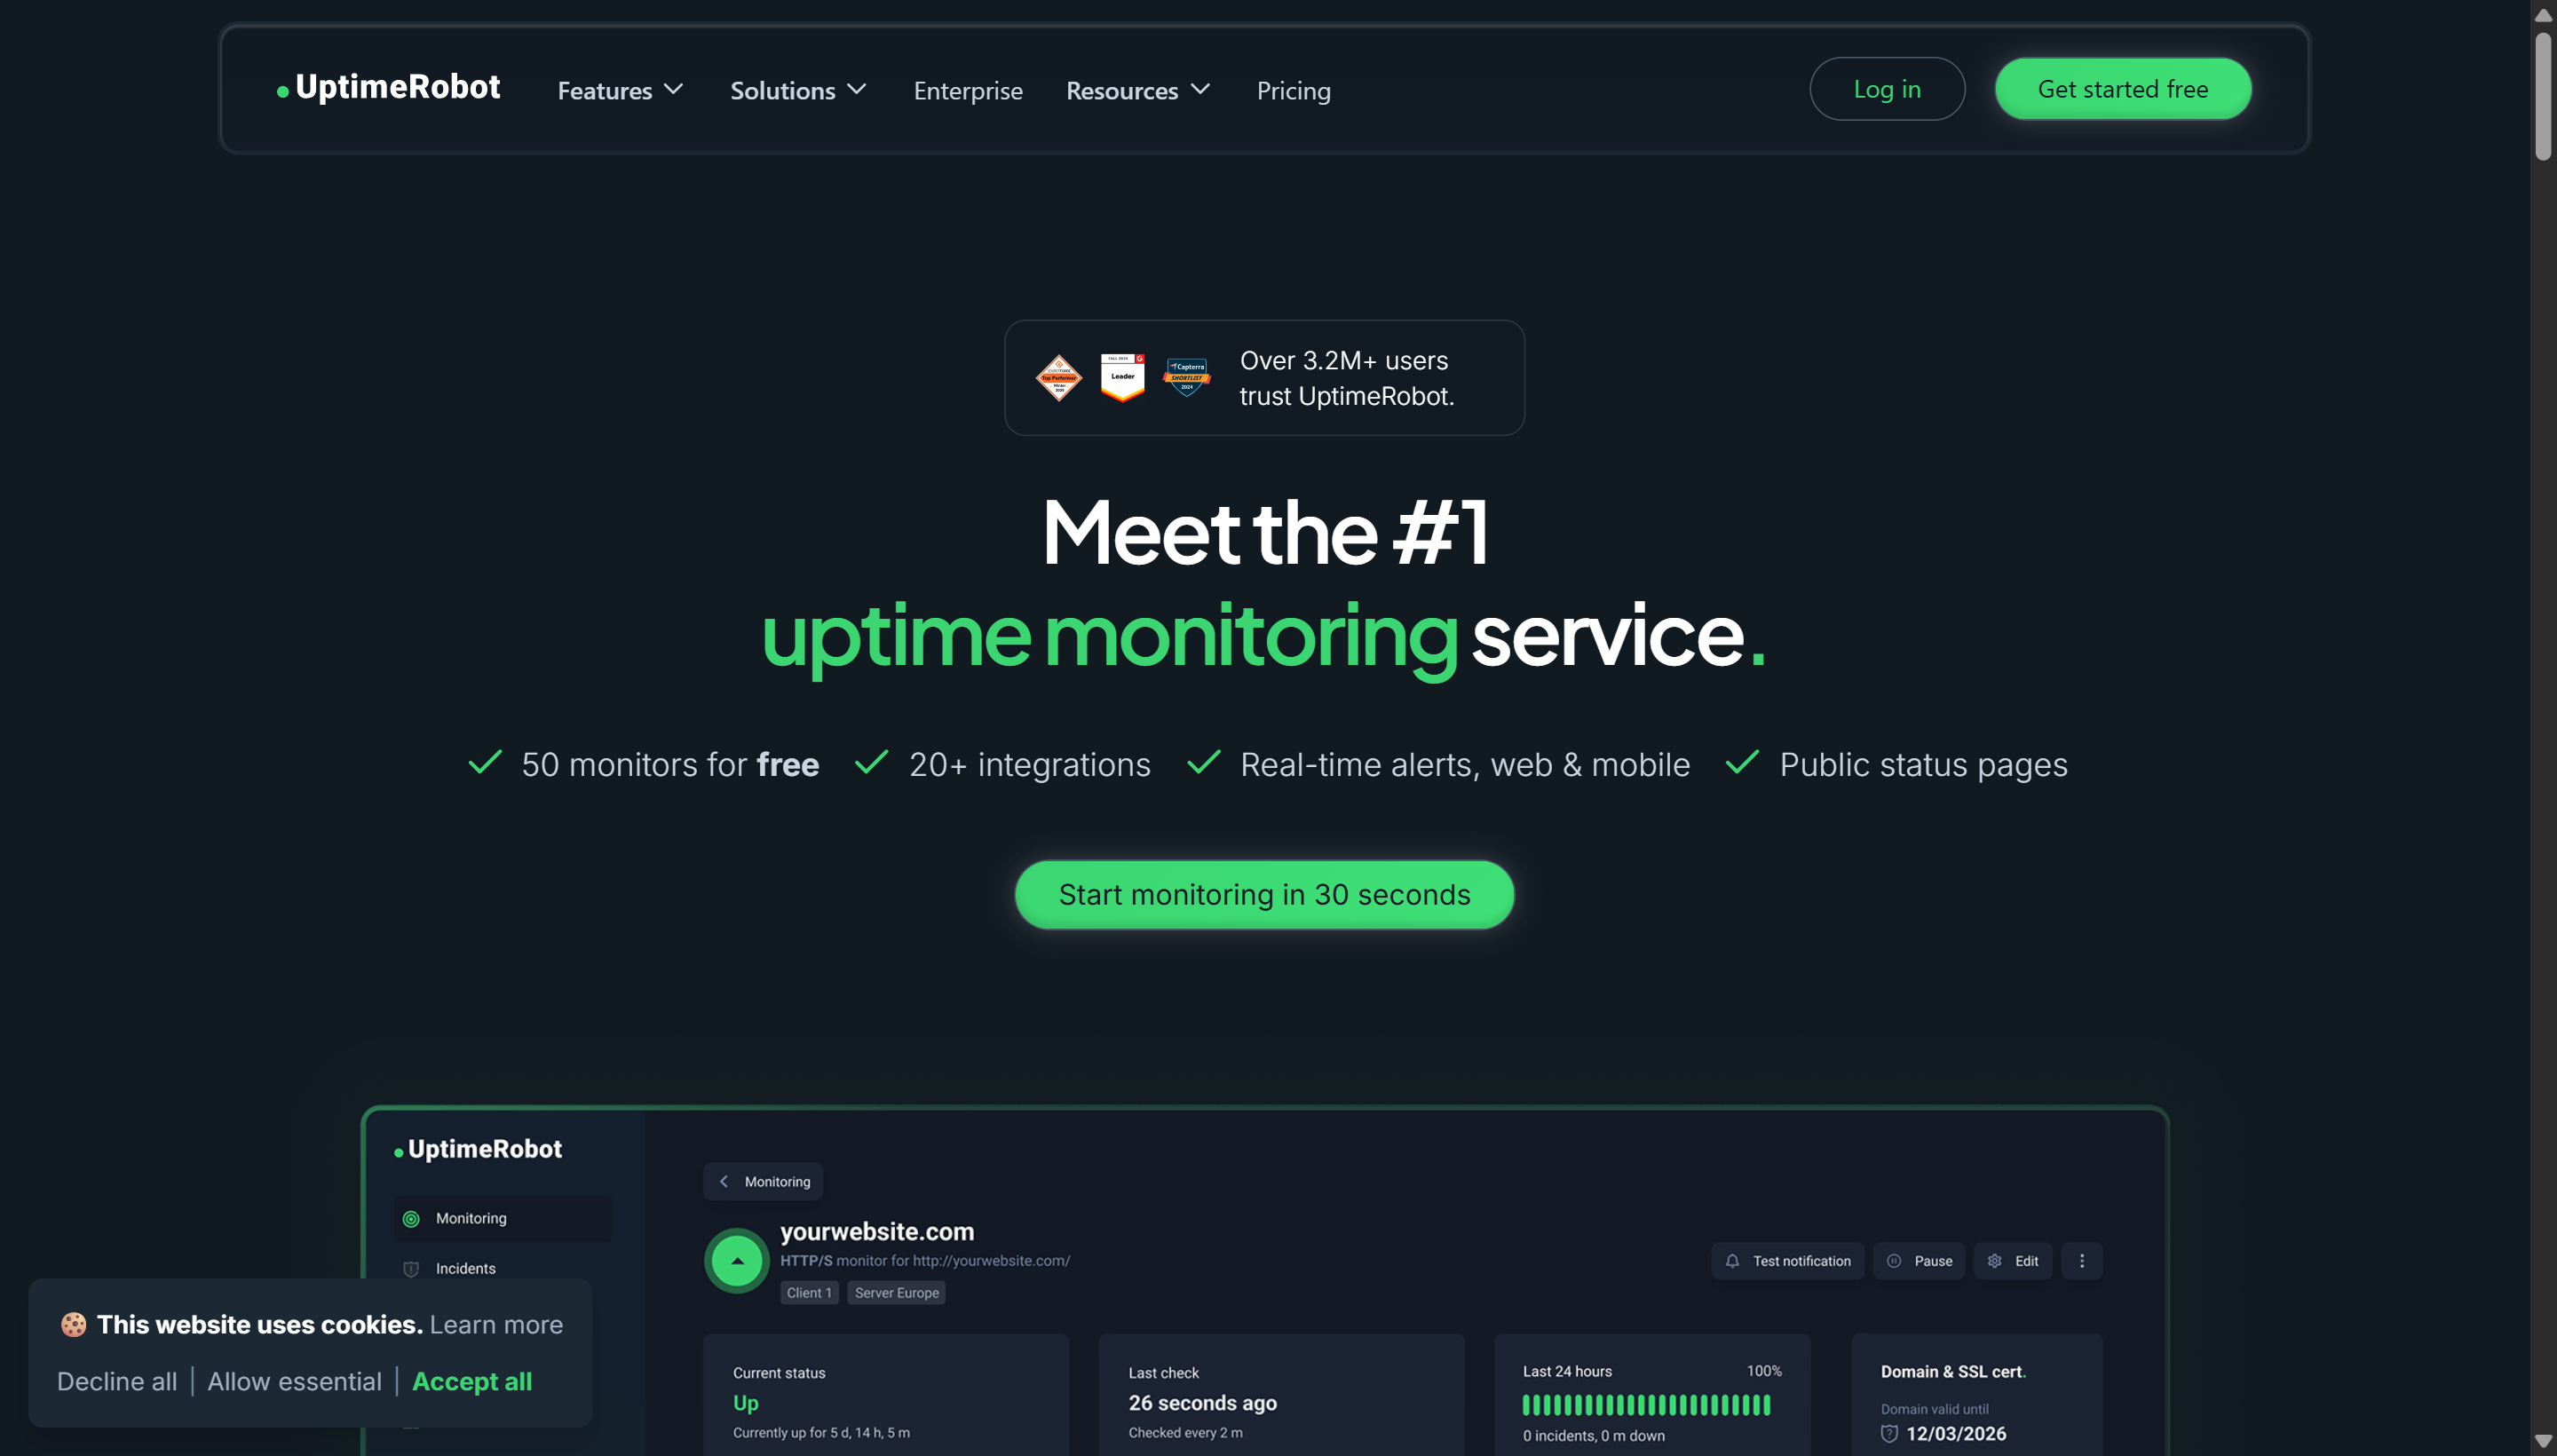
UptimeRobot free plan: 50 monitors, 5-minute check interval, email alerts. This is sufficient for every project in this workshop — you'll never hit the 50-monitor limit during training. Paid plans add 1-minute intervals and SMS/Slack notifications, which become relevant on production commercial apps.