UptimeRobot Setup
Creating your UptimeRobot account and adding your first monitors for the production app and Supabase API.
UptimeRobot is the industry-standard free uptime monitoring service. It has been running since 2010 and is used by millions of developers. The free plan gives you 50 monitors with 5-minute check intervals — more than enough for every project in this workshop.
Setup takes about 10 minutes. By the end, UptimeRobot will be checking your production app every 5 minutes around the clock.
Creating Your Account
Go to uptimerobot.com
Open your browser and navigate to uptimerobot.com. Click "Register for FREE" in the top navigation.
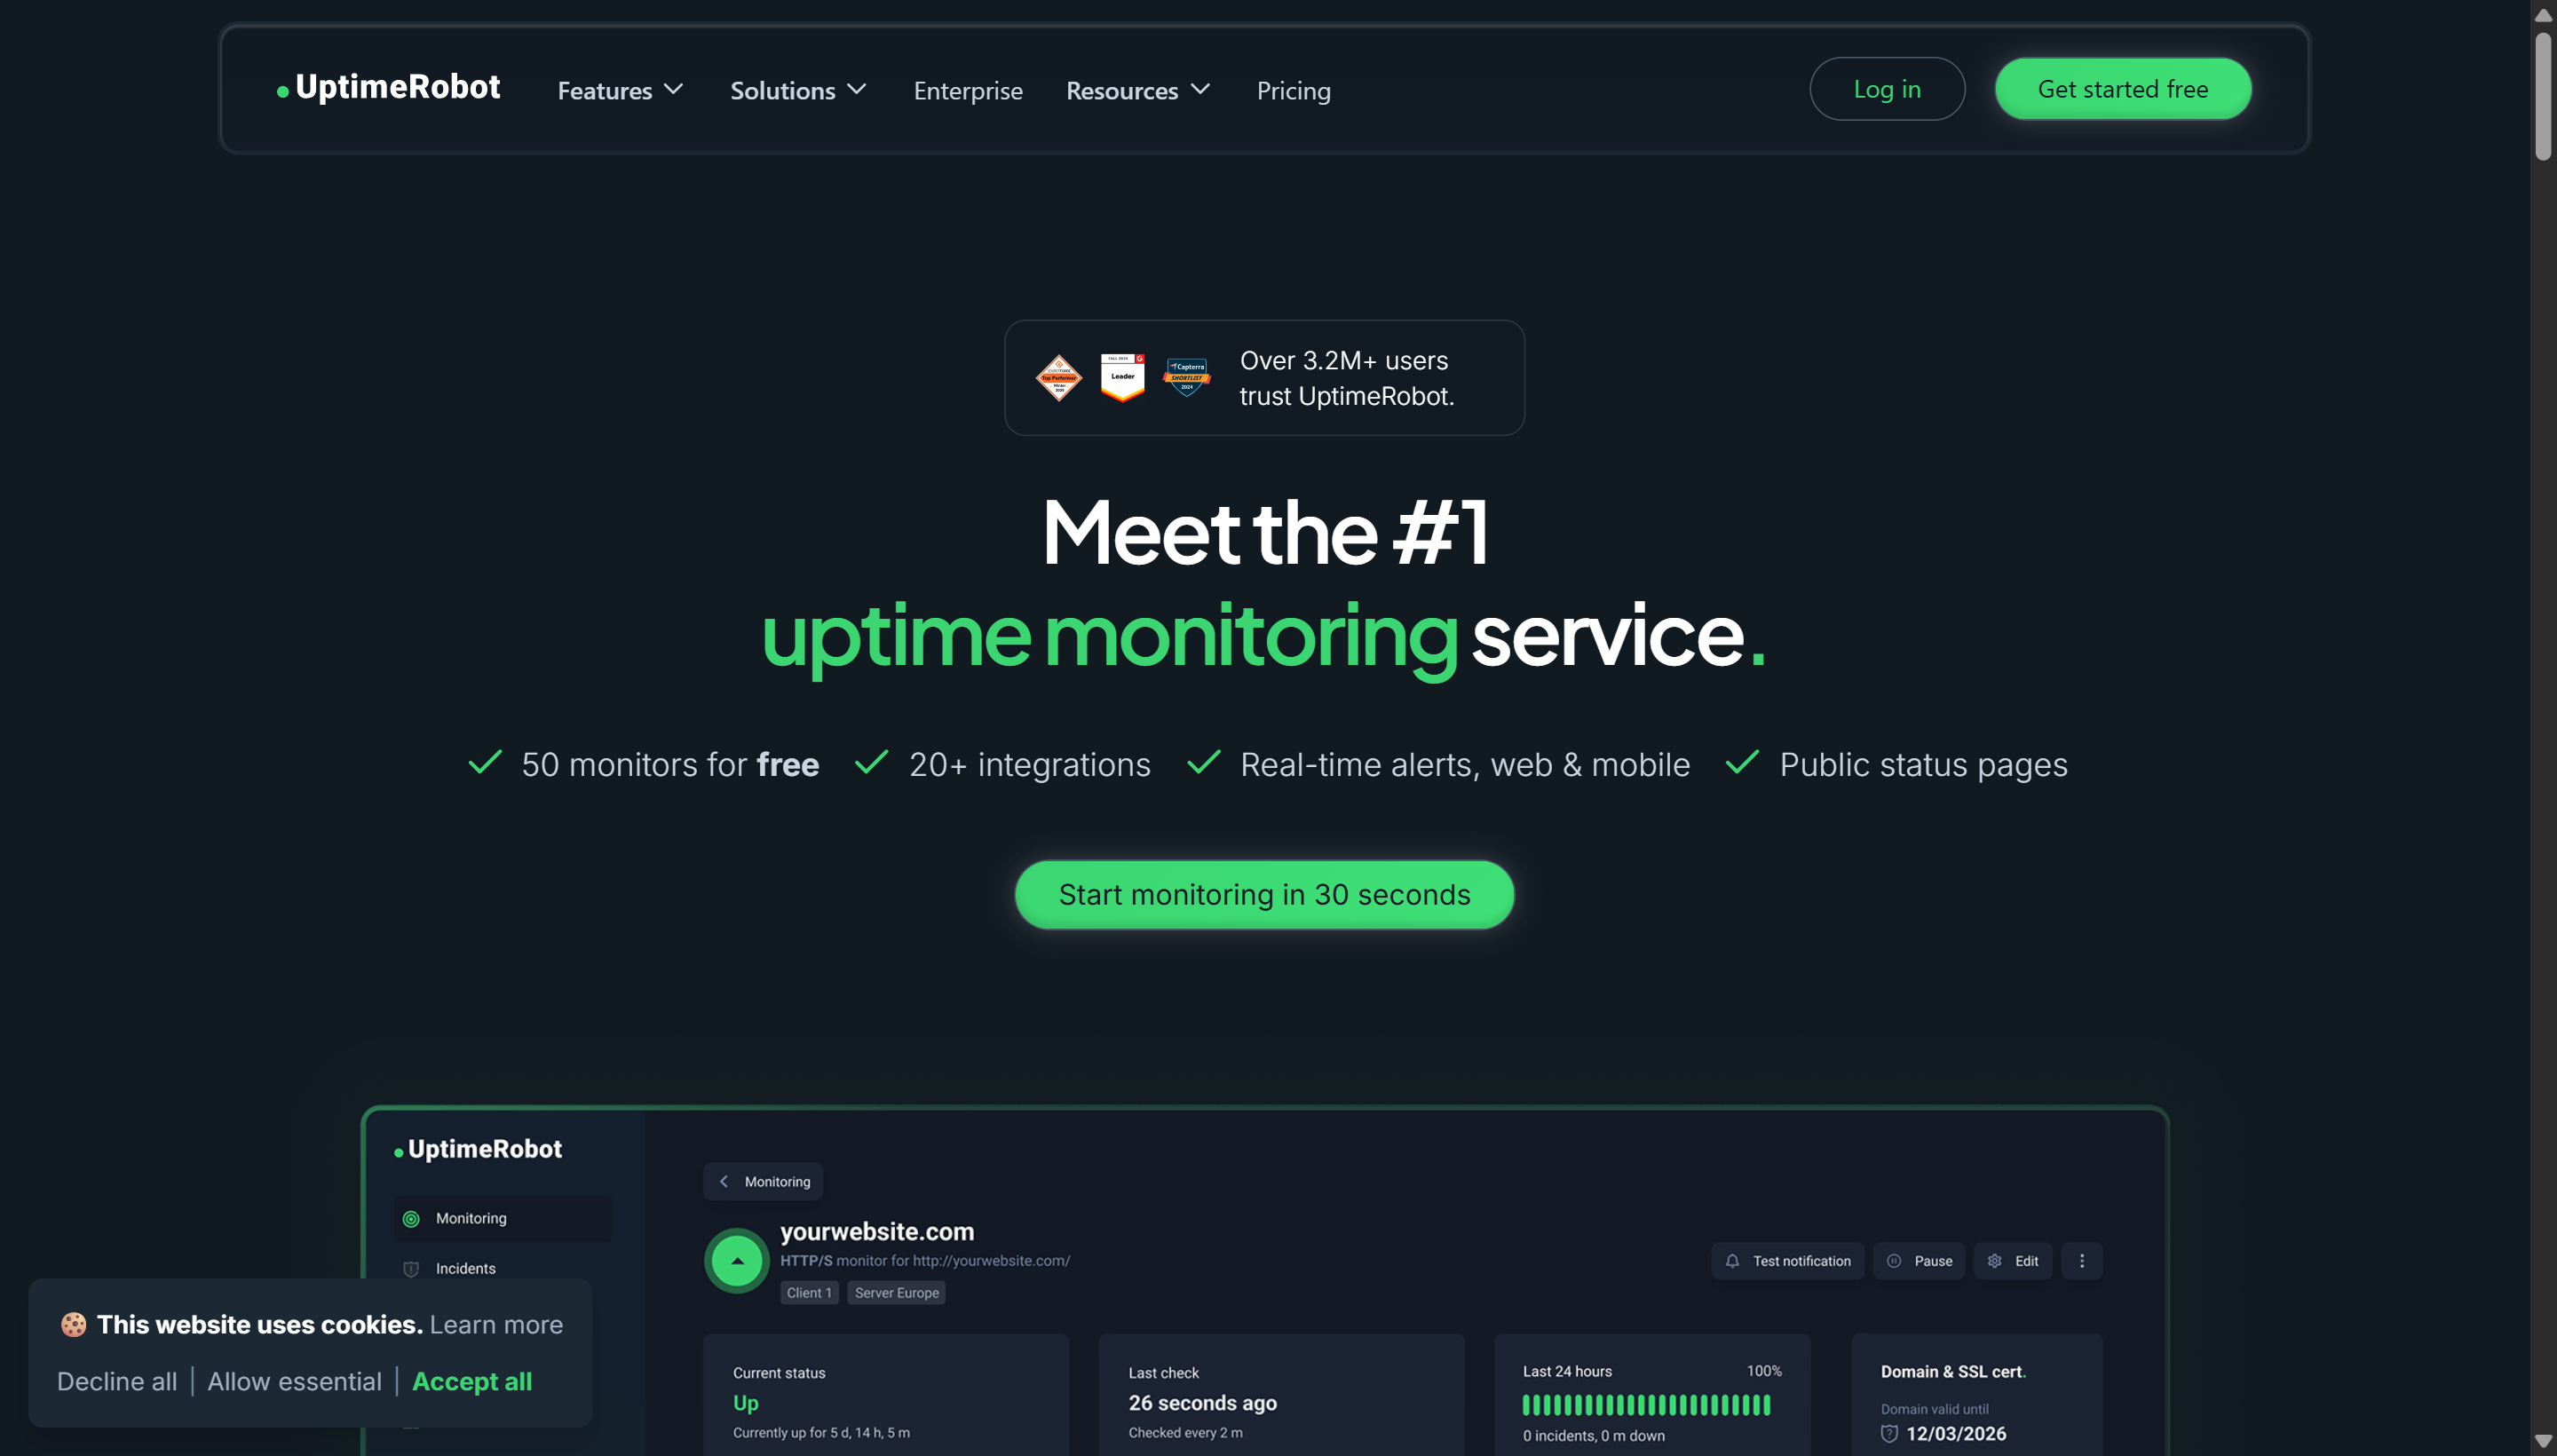 UptimeRobot homepage. Click "Register for FREE" — the free plan gives you 50 monitors with 5-minute check intervals, which is more than enough for every project in this workshop.
Fill in the registration form
| Field | What to enter |
|---|---|
| Full Name | Your name |
Use the project Gmail account (e.g., aurorapublicschool@gmail.com) — not your personal email. Alerts go to this address. | |
| Password | A strong password — save it in your password manager |
Accept the terms and click "Register".
Verify your email
UptimeRobot sends a verification email. Open it and click the confirmation link. You cannot create monitors until your email is verified.
Log in to the dashboard
After verification, log in. You'll land on the main dashboard — currently empty with no monitors configured.
Understanding the Dashboard
Before adding monitors, take 60 seconds to understand the layout.
| Section | Purpose |
|---|---|
| My Monitors (main area) | List of all your monitors — current status, response time, uptime percentage |
| + Add New Monitor button | Opens the monitor creation dialog |
| My Settings (top right menu) | Alert contacts, API keys, notification settings |
| Status Pages | Create public-facing status pages for your clients |
| Reports | Historical data and downtime reports |
The status column uses a simple colour system:
- Green (Up) — The URL is responding correctly
- Red (Down) — The URL is not responding or returning an error
- Yellow (Seems Down) — Checking — saw a failure but hasn't confirmed yet
- Grey (Paused) — Monitor is paused manually
Adding Your First Monitor — Production App
Click "+ Add New Monitor"
The "New Monitor" dialog opens.
Set Monitor Type to HTTP(S)
The monitor type dropdown has several options. Select HTTP(S). This type sends a real HTTP request to your URL and checks that it returns a successful response — exactly what a user's browser does.
Other types (Ping, Keyword, Port) are for more advanced use cases. HTTP(S) is the right choice for web apps.
Enter the Friendly Name
This is just a label for your own reference — it appears in alerts and the dashboard. Use something clear:
Or for your personal project:
Enter the URL
This is the full URL of your production deployment — the one Vercel gave you after your first deploy.
Or if you have a custom domain:
Always use the https:// version of your URL, not http://. Vercel automatically redirects HTTP to HTTPS, but monitoring the HTTP URL adds an extra redirect step that can mask some errors. Monitor the canonical HTTPS URL directly.
Set Monitoring Interval
Leave this at 5 minutes — it's the minimum on the free plan. This means UptimeRobot checks your app once every 5 minutes, 24 hours a day, 7 days a week. If your app goes down, you'll know within 5 minutes.
Leave other fields at their defaults for now
- Monitor Timeout: 30 seconds (default) — if the app doesn't respond within 30 seconds, it's considered down
- HTTP Method: GET (default) — a standard page load request
- Alert Contacts: We'll add this after creating the monitor — skip for now
Click "Create Monitor"
The monitor appears in your list with status "Checking...". Within 1–2 minutes it will update to green (Up) or red (Down).
What Happens After Creation
Within 1–2 minutes, UptimeRobot completes its first check. The status updates to:
- Up (green) — Your app is accessible. The monitor shows the response time in milliseconds — typically 100–300ms for a Vercel app.
- Down (red) — Something is wrong. Check your Vercel deployment and browser-test the URL yourself.
Once the monitor is running, the dashboard shows:
| Column | What it means |
|---|---|
| Status | Current up/down state |
| Monitor name | The friendly name you set |
| Type | HTTP(S) |
| Check interval | 5 minutes |
| Last check | When the most recent check ran |
| Response time | How long the server took to respond (in milliseconds) |
| Uptime (7 days) | Percentage of the last 7 days the app was up |
| Uptime (30 days) | Percentage of the last 30 days the app was up |
Adding a Second Monitor — Supabase API
Your app has two failure points: the Vercel frontend and the Supabase backend. Monitoring only the Vercel URL tells you when the frontend is down, but not when Supabase is having issues. Add a dedicated Supabase monitor.
Click "+ Add New Monitor" again
Set Monitor Type to HTTP(S)
Set Friendly Name
Enter the Supabase REST URL
The Supabase REST API URL is always in this format:
Find your project ref in one of these places:
- Your
.envfile — theVITE_SUPABASE_URLvalue. Take the subdomain part. For example: if the URL ishttps://abcdefghijkl.supabase.co, your project ref isabcdefghijkl - The Supabase dashboard URL in your browser:
app.supabase.com/project/abcdefghijkl
The full URL to monitor:
This endpoint returns a 200 response when Supabase is healthy and a non-200 (or no response) when it's having issues.
Set Monitoring Interval to 5 minutes
Click "Create Monitor"
You now have two monitors: one watching your frontend, one watching your backend. If either goes down, you'll know within 5 minutes.
Interpreting Response Times
Response time is a secondary health signal — not just a binary up/down.
| Response time | What it means |
|---|---|
| < 200ms | Excellent — Vercel edge is serving this fast from a nearby region |
| 200–500ms | Normal — acceptable for most apps |
| 500ms–1s | Slow — worth investigating (could be a slow database query or server cold start) |
| > 1s | Problematic — users will notice this lag |
| Timeout (> 30s) | Treated as Down — monitor fires alert |
A sudden spike in response time — from 250ms to 900ms — often signals a problem before a full outage. UptimeRobot's response time graph (click any monitor to see it) makes these spikes visible.
What You Have Now
Two monitors running:
- Aurora Public School — Production — checks
https://aurora-public-school.vercel.appevery 5 minutes - Aurora Public School — Supabase API — checks the Supabase REST URL every 5 minutes
Both are currently showing status and response times. The next step is configuring alerts so you're notified by email when either goes down.