Dashboard Guide
How to read a Sentry stack trace, use breadcrumbs to recreate bugs, set up alerts, and use the Performance tab effectively.
Sentry captures errors automatically. Understanding how to read what it captures is the skill that turns raw error data into actionable fixes — often in under 5 minutes.
This page teaches you to use the Sentry dashboard the way an experienced developer does.
The Issues List
When you open Sentry and navigate to Issues, you see a table. Each row is a distinct error — a unique combination of error type, location, and stack trace. If the same error happens 50 times, it still appears as one row, with an event count of 50.
What each column means
| Column | What it tells you |
|---|---|
| Title | The error message. This is the text after Error: or TypeError:. Example: "Cannot read properties of undefined (reading 'studentId')" |
| Graph | A mini bar chart of how often this error occurred over the selected time range. A spike means something triggered it repeatedly — often a bad deploy or a specific user action pattern |
| Events | Total number of times this error has occurred. "1 event" means it happened once. "847 events" means the same error has occurred 847 times |
| Users | How many distinct users triggered this error. "847 events, 3 users" means the same 3 people kept hitting the same bug — probably something specific to their data or their device |
| First Seen | When Sentry captured this error for the first time ever |
| Last Seen | When the most recent occurrence happened |
| Assignee | Which team member is looking into this |
Status and filtering
Issues have three states:
- Unresolved — the error is active and happening
- Resolved — you've marked it fixed (manually, or via a Sentry release)
- Ignored — you've decided this error is not worth fixing right now (known third-party noise, for example)
By default, the Issues list shows only Unresolved issues. This is the right default — your daily habit is to keep this list at zero. An empty Issues list means nothing new has broken since you last checked.
Reading a Stack Trace
Click any issue in the list to open the full detail view. This is where most of the actionable information lives.
The Exception section
At the top, you see the error type and message:
This is the JavaScript error that was thrown. The type (TypeError) tells you the category of error. The message tells you exactly what went wrong: something was undefined when your code tried to read the .id property from it.
In plain English: your code expected an object with an id field, but the variable was undefined (empty). The most common cause is data that hasn't loaded yet, or a Supabase query that returned nothing.
The Stack Trace section
The stack trace shows the chain of function calls that led to the error. The most recent call is at the top. Read it top-to-bottom to understand the sequence:
This tells you:
- The user clicked something (
onClickinFeePaymentForm.tsxline 89) - That called
handleSubmiton line 112 of the same file - Which called
processFeePaymentinfeePayment.ts - Which crashed on line 47 when it tried to read
.idfrom an undefined variable
Open feePayment.ts at line 47. You'll almost certainly see the bug immediately.
This only works with source maps. Without them, the stack trace shows minified code that looks like n.t at main.abc123.js:1:4892 — essentially useless. This is why the Auth Tokens section (setting up source maps) is not optional. Source maps transform Sentry from a notification system into a debugging tool. Set them up before your first real production deploy.
The Tags section
To the right of or below the stack trace, Sentry shows tags — metadata about the error occurrence:
| Tag | What it tells you |
|---|---|
| browser | Chrome 124, Safari 17, Firefox 125 — browser-specific bugs are common |
| browser.version | Sometimes a bug only affects an older version |
| os | Windows 11, macOS 14, iOS 17, Android 14 |
| device | iPhone 14 Pro, Samsung Galaxy S23 — mobile-specific bugs |
| url | Which page the user was on when the error occurred |
| user.email | Which user triggered it (set by Sentry.setUser() after login) |
| release | Which version of your code was running — ties the error to a specific deploy |
If you see "browser: Safari 17" and the same error doesn't appear for Chrome users — you have a browser-specific bug. That context alone cuts debugging time in half.
Breadcrumbs — Recreating the Bug
This is one of Sentry's most powerful features and the one most developers don't know to look for.
Breadcrumbs are a log of everything the user did in the 20–30 seconds before the error occurred. Every click, every navigation, every network request, every console message — all timestamped and recorded automatically.
What breadcrumbs look like
Reading this from top to bottom: the parent went to the fee payment page, clicked "Select Fee", the fee list loaded successfully, they clicked "Pay Now", the payment API returned a 500 error, and that response triggered the crash.
The bug isn't in the frontend at all — the backend returned a 500 error, the frontend tried to read .id from the failed response, and crashed. Fix: the frontend needs to handle API errors gracefully, and the backend needs to not return 500 on what is probably a validation issue.
Without breadcrumbs, you'd see a TypeError and spend hours trying to reproduce it. With breadcrumbs, you know exactly what triggered it and have a clear reproduction path: go to the fee payment page, select a fee, click Pay Now.
Use breadcrumbs before touching the code. When you open a Sentry issue, scroll to the Breadcrumbs section before you look at the stack trace. The breadcrumbs tell you what the user was doing — that context shapes how you read the code. A bug that looks like a frontend data problem in the stack trace often turns out to be a backend validation problem in the breadcrumbs. Start with the context, then read the code.
Types of breadcrumbs you'll see
| Type | What it records |
|---|---|
| navigation | Page changes (route changes in your React app) |
| ui.click | Every button click, link click, form submission |
| http | Every network request — method, URL, status code |
| console | Any console.log, console.warn, or console.error in your code |
| query | Database queries (if Sentry performance tracing is enabled) |
| error | Previous errors that were caught and ignored before the fatal one |
Setting Up Alerts
By default, Sentry sends one email when a new type of error first appears. You can customise this — add a spike alert for when errors start occurring rapidly, or add a team notification channel.
Recommended alert rules for client projects
Alert when a new issue is created
This is already enabled if you selected "Alert me on every new issue" during project creation. Verify it's active:
Settings → Alerts → look for a rule named "Send a notification for new issues". If it exists and has your email as the action, you're set.
Add a spike alert
You want to know immediately if the same error starts occurring rapidly — it usually means a bad deploy reached all your users.
Settings → Alerts → Create Alert Rule:
- Type: Metric alert
- Condition: Number of errors > 50 in 1 hour
- Action: Send email to your address
- Name: High Error Rate Spike
Adjust the threshold based on your app's normal traffic. For a new app with few users, 20 errors in an hour is already a spike. For a high-traffic app, 500 might be the right threshold.
Review alerts by severity (optional, for later)
Once you're comfortable with Sentry, you can set alerts per severity level — "alert me immediately for fatal level errors, send a daily digest for warning level". This is useful when your app is mature and most warning level noise doesn't need immediate attention.
Resolving Issues
When you fix a bug and deploy the fix:
- Find the issue in the Issues list
- Click the issue → click "Resolve" (or use the keyboard shortcut
R) - Sentry marks it resolved
If the same bug reappears in a future deploy, Sentry automatically reopens the issue and notifies you — tagged as a "regression". This is the release tracking feature in action: Sentry knows the bug was fixed in v1.4.3 but has reappeared in v1.5.0.
For bugs you intentionally won't fix — a third-party library error outside your control, a browser extension conflict — click "Ignore". You can set an ignore duration (ignore for 1 week, ignore until X occurs Y more times) so you're prompted to reconsider if it becomes worse.
The Performance Tab
Open Performance in the left sidebar. This is where Sentry shows you how fast (or slow) your app is in real users' browsers — not your fast developer laptop, but actual iPhones on 4G connections in Hyderabad.
What you'll see
| Metric | What it means | Good threshold |
|---|---|---|
| LCP (Largest Contentful Paint) | How long until the main content appears | Under 2.5 seconds |
| FCP (First Contentful Paint) | How long until anything appears | Under 1.8 seconds |
| CLS (Cumulative Layout Shift) | How much the page jumps around while loading | Under 0.1 |
| INP (Interaction to Next Paint) | How fast the app responds to clicks | Under 200ms |
| TTFB (Time to First Byte) | How long until the server responds | Under 800ms |
Sentry shows these as P75 values — meaning 75% of users experience the metric at this value or better. A P75 LCP of 3.2 seconds means 1 in 4 users is waiting more than 3.2 seconds for your main content.
Why this matters
Google uses Core Web Vitals (LCP, CLS, INP) to rank websites in search results. A slow site doesn't just frustrate users — it ranks lower, gets fewer visitors, and the client's business suffers. Knowing about a performance problem early (from Sentry's Performance tab) means you can fix it before it affects rankings and before the client notices.
The CA analogy: like a balance sheet that reveals a slow revenue leak before it becomes a liquidity crisis. The data is there — you just have to look at it.
The Releases Tab
Open Releases in the left sidebar. When the Sentry Vite plugin is configured (Auth Tokens section), every deploy creates a release entry here.
Each release shows:
- Which git commit it corresponds to
- How many new errors appeared in this release vs. the previous one
- A comparison: "3 new issues, 7 resolved" tells you this deploy introduced 3 new bugs but fixed 7 existing ones
- The deploy time and environment (production vs staging)
This view answers a common question after a bad deploy: "Was this bug in the last version, or did our deploy introduce it?" You click the release, see the issues list for that release, and have the answer in seconds.
Dashboards — Custom Views
The default Issues list shows everything chronologically. Dashboards let you build a tailored monitoring screen with the widgets that matter for your project. Common widgets:
- Errors per hour, last 24h
- Top 10 issues by user impact (events × distinct users)
- LCP P75 by route
- Release health — crash-free session percentage
- Issues by environment (production vs preview)
Create one dashboard per project and bookmark it. This becomes the "dashboard you check before logging off for the day."
Discover — Custom Queries
 Discover is Sentry's query builder. You compose conditions (e.g. "events where browser = Safari and release = v1.4.0 grouped by error message") and the result table is fully exportable.
Discover is for ad-hoc investigation — when you need to answer a specific question that the standard Issues view does not surface directly. Examples:
- "How many users on Android 12 hit any error in the last 7 days?"
- "Which release introduced the most errors per session?"
- "What is the error rate during the 8–9am peak usage window?"
Save a Discover query as a dashboard widget once you've found a useful pattern.
Settings — Members, Teams, Integrations
When you eventually onboard a teammate or wire Sentry up to Slack, these three settings pages matter.
Members
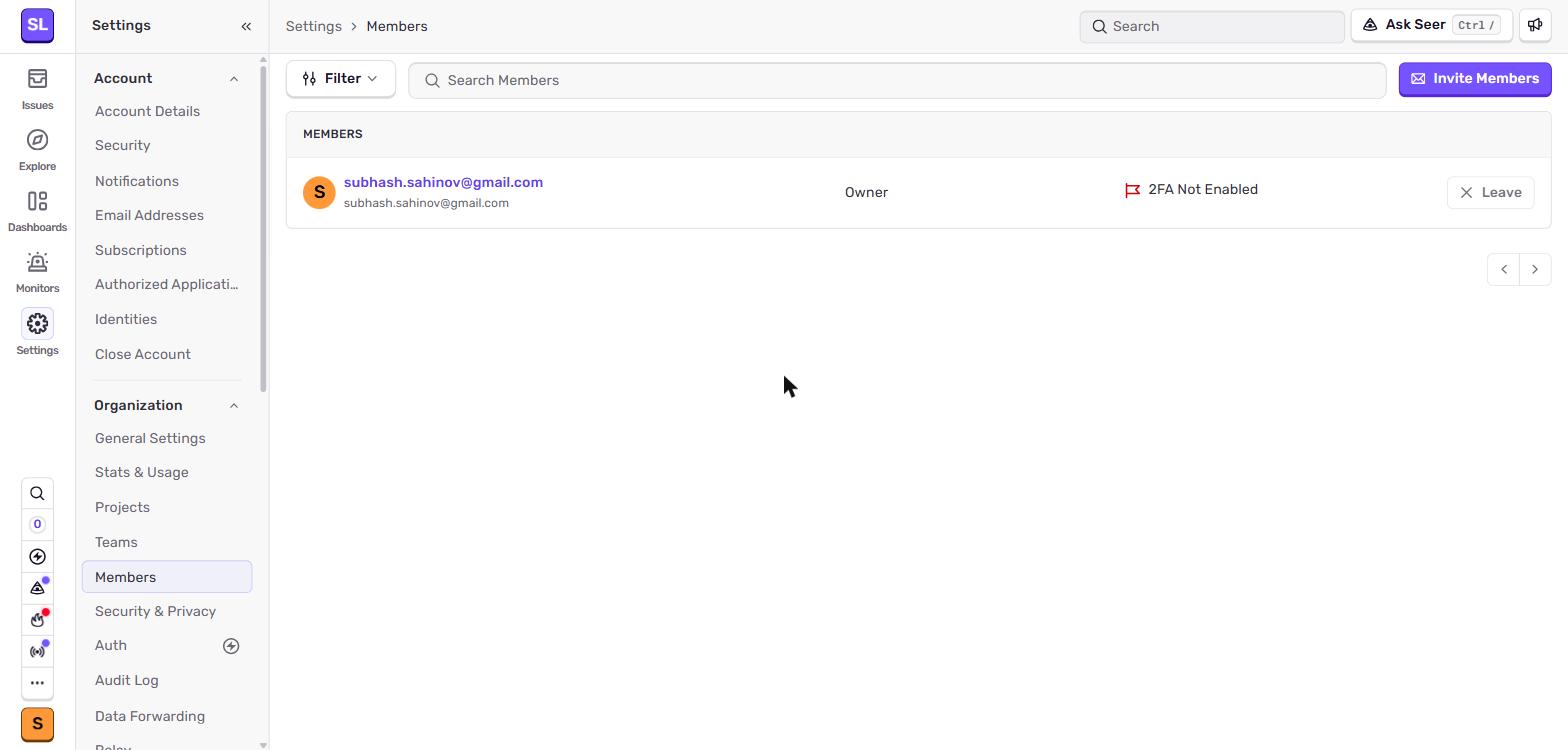 Members page — invite teammates by email and set their role (Owner, Manager, Admin, Member, Billing). Most trainees should be added as "Member" — full access to issues without billing or org-level changes.
For Sahinov projects, Subhash is the Owner. Trainees joining the Aurora Public School team get added as Members with access to the relevant project only.
Teams
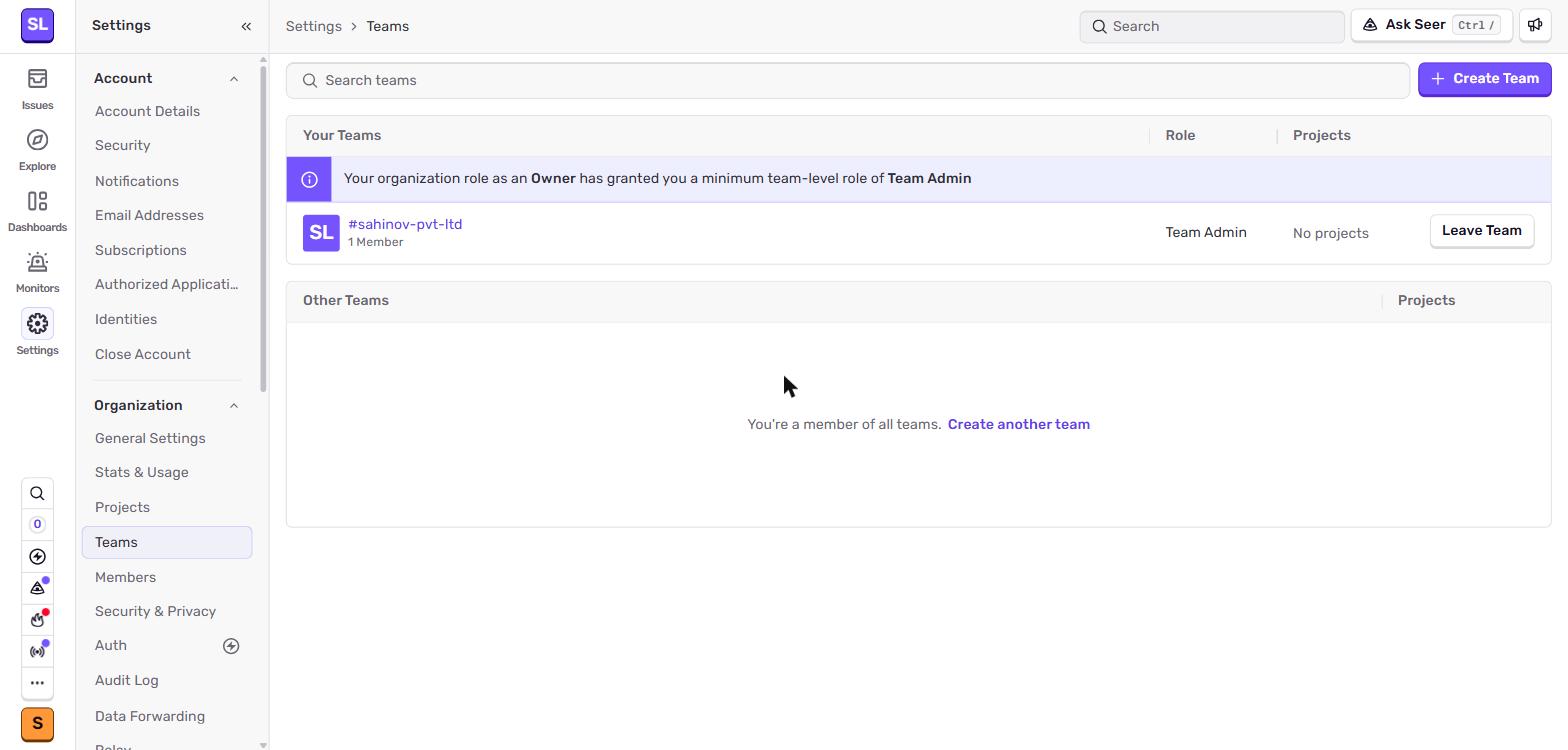 Teams group members and projects together. A team can own multiple projects; a project can be assigned to one or more teams.
For solo projects, the default team is enough. For Aurora Public School, create separate teams ("Mobile", "Web", "Admin") so issue assignments and notifications route to the right people.
Integrations
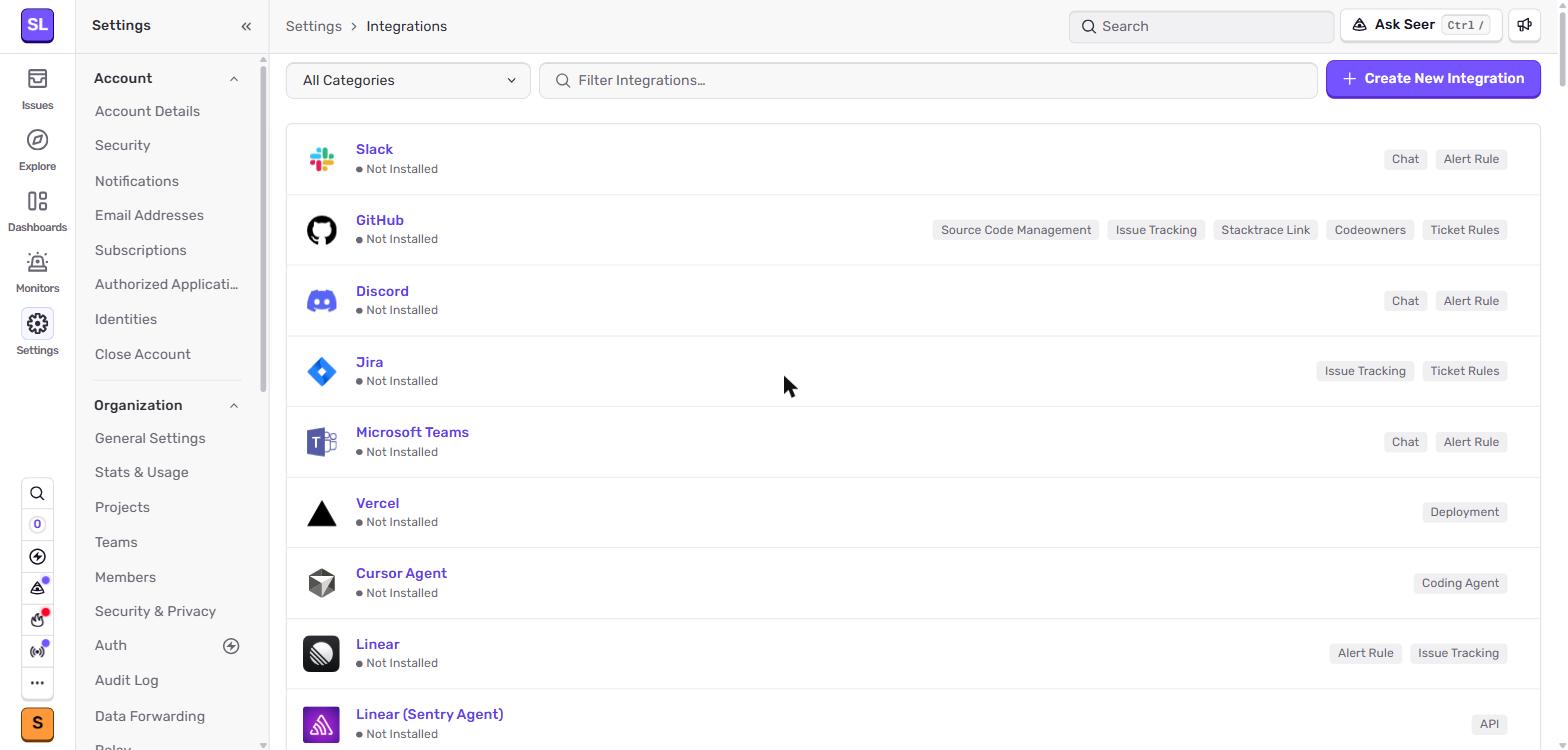 Integrations — connect Sentry to GitHub (auto-link issues to commits), Slack (route alerts to a channel), Vercel (auto-create releases on deploy).
Three integrations are worth setting up on every project:
| Integration | What it does |
|---|---|
| GitHub | Each Sentry issue links to the commit that caused it. "First seen in a3f9b2c" becomes a clickable link to the diff. |
| Slack | Alerts route to a channel instead of (or in addition to) email. Useful when a team needs to see incidents collectively. |
| Vercel | Releases auto-created on each Vercel production deploy — no manual sentry-cli releases new step needed. |
The GitHub and Vercel integrations are the most valuable. Slack is optional during training (one-person team) and useful once a team is collaborating.
Organisation Settings
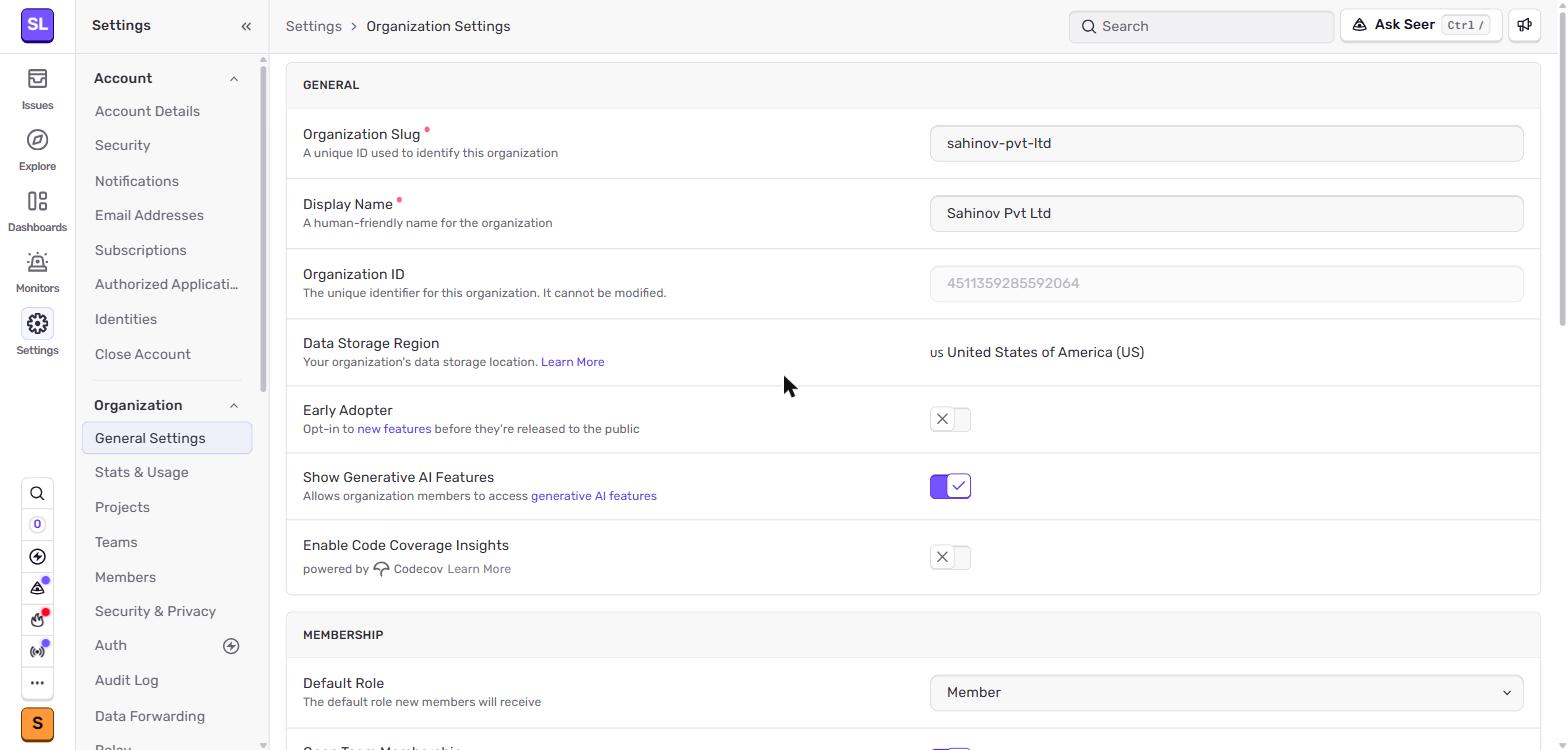 Organisation settings — organisation name, slug, default role for new members, data scrubbing rules, retention.
Two settings here you should review once per project:
- Default role — what role new invited members get. Set this to Member (not Admin) so accidental invites don't grant elevated access.
- Data scrubbing — Sentry can automatically redact fields it detects as sensitive (passwords, credit card numbers). Enable for any project handling personal data.